Quality: Difference between revisions
(→Waste: Rewrote.) |
(Update quality information to correspond to 2020-02-21 update) |
||
| Line 59: | Line 59: | ||
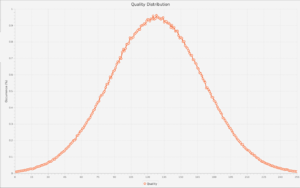
[[File:QualityDistribution.png|thumb|none|Supposedly a "bell shape".]] | [[File:QualityDistribution.png|thumb|none|Supposedly a "bell shape".]] | ||
Quality is distributed normally, with a mean of 128 and a standard deviation of 42.3333333. | |||
[[Category:Science]] | [[Category:Science]] | ||
Latest revision as of 16:25, 25 February 2020
| Descriptor | Quality |
|---|---|
| Flawed | 1 - 34 |
| Bad | 35 - 74 |
| Poor | 75 - 114 |
| Fair | 115 - 154 |
| Good | 155 - 194 |
| Fine | 195 - 224 |
| Superb | 225 - 244 |
| Excellent | 245 - 254 |
| Perfect | 255 |
The quality, also known as simply Q or QL, of an object is a measure of how pure/well refined/advanced/etc. that object is.
A quality descriptor helps with easier recognition of quality, as seen on the table.
Low-quality materials will lower the quality of goods made with them. So if you collect Bad Oil, you are likely to produce Bad Plastic and hence Bad Electronic Parts.
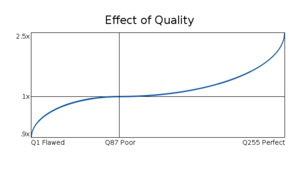
Effect of Quality
Waste
When commodities are fetched to a construction site or a manufacturing process a quality check is performed. If this quality check fails, the commodity is wasted.
This means that low quality commodities can fail and be wasted when attempting to fetch them. It is therefore always a good idea to opt for better quality resources whenever possible.
Effectiveness
The effectiveness of most objects is improved as quality gets higher, this is however not a linear increase.
The range of quality effect goes from .9x at Q1 Flawed to 1x at Q87 Poor to 2.5x at Q255 Perfect. The line follows a curve that rewards the difficulty of achieving very high quality.

The scaling is not symmetrical above and below the 1x line, to show the curve. Otherwise that side of the line is pretty flat since it only represents a .1x difference, the worst of it at the very lowest qualities.
Quality Rarity
The rarity of high quality resources is thanks to the generation of the universe. The most common quality is around 128.

Quality is distributed normally, with a mean of 128 and a standard deviation of 42.3333333.